The Economic Research Department of Nepal Rastra Bank (NRB) has published a report on Nepal’s Current Macroeconomic and Financial Situation based on three months of data ending mid-October 2024/25.

This report highlights key economic indicators like inflation, trade, and fiscal performance, giving a clear picture of Nepal’s economy during this period. This article summarizes the main findings and trends shaping the country’s financial and economic outlook.
Inflation
In mid-October 2024, Nepal’s year-on-year consumer price inflation (CPI) decreased to 4.82% from 7.50% the previous year. Food and beverage inflation was higher at 7.18%, driven by significant increases in vegetable prices (25.15%), pulses (10%), and cereal grains (9.57%). Meanwhile, non-food and services inflation stood at 3.49%, with notable rises in miscellaneous goods (10.49%) and alcoholic drinks (6.32%).

Rural areas experienced slightly higher inflation (5.00%) than urban areas (4.76%). Among provinces, Sudurpashchim Province had the highest inflation (6.56%), while Karnali Province recorded the lowest (3.25%). Regional inflation ranged from 4.32% in the hills to 5.23% in the Terai.

Wholesale price inflation rose to 5.51%, driven by increased consumption and intermediate goods, although construction material prices dropped by 4.58%. Salary and wage growth slowed to 3.36% compared to 5.65% a year ago. Nepal’s inflation was relatively lower compared to India’s CPI of 6.21% in October 2024.
External Sector

Nepal’s external sector showed mixed trends during the first three months of 2024/25. Merchandise exports decreased by 6.1% to Rs.38.38 billion, with declines across key destinations like India (5.3%), China (24.8%), and other countries (6.6%). Exports of soybean oil, tea, and particle board increased, while products like zinc sheets and palm oil saw declines. Imports also fell by 4.2% to Rs.390.75 billion, driven by reduced imports of gold, petroleum, and electrical equipment, although imports of vehicles and edible oil rose. The trade deficit narrowed by 4.0% to Rs.352.37 billion, with the export-import ratio at 9.8%.
Net services income remained in deficit at Rs.23.29 billion, though travel income slightly increased to Rs.17.72 billion. Remittance inflows grew by 11.5% to Rs.407.31 billion, with a notable increase in the number of workers renewing foreign employment approvals.

Nepal’s current account surplus reached Rs.111.87 billion, and the Balance of Payments (BOP) surplus increased to Rs.184.99 billion. Foreign exchange reserves rose by 9.4% to Rs.2232.28 billion, sufficient to cover 17.6 months of merchandise imports. The Nepalese currency depreciated slightly by 0.6% against the US dollar, with the exchange rate at Rs.134.17 per dollar in mid-October 2024.
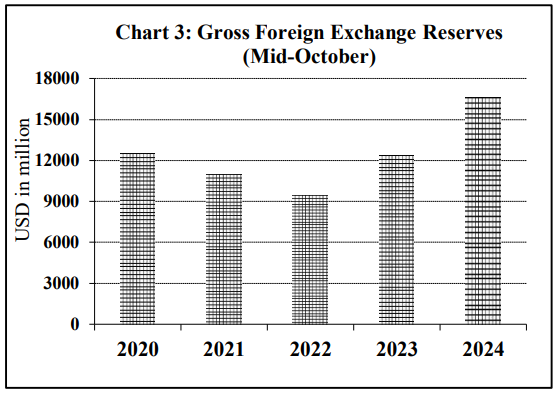
Global trends included a 20.4% drop in crude oil prices and a 38.7% rise in gold prices during the review period.
Fiscal Situation
During the first three months of FY 2024/25, Nepal’s total government expenditure reached Rs.329.20 billion. This included Rs.229.85 billion in recurrent spending, Rs.29.37 billion in capital expenditure, and Rs.69.97 billion in financial expenditure. Revenue mobilization during this period totaled Rs.248.26 billion, with tax revenue contributing Rs.219.68 billion and non-tax revenue Rs.28.58 billion.
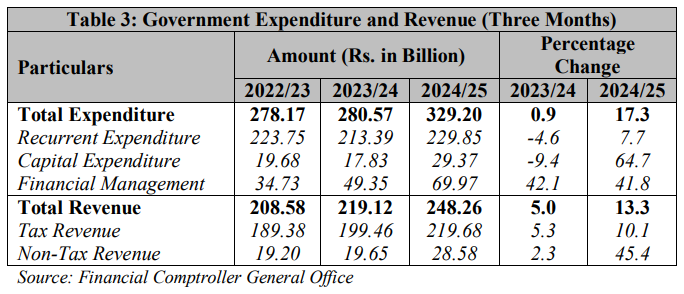
The government’s cash balance, including provincial and local accounts, rose to Rs.175.66 billion in mid-October 2024, up from Rs.91.78 billion in mid-July 2024. Provincial governments recorded Rs.20.92 billion in expenditures while mobilizing Rs.37.95 billion in resources, of which Rs.30.05 billion came from federal grants and Rs.7.91 billion from their revenue and other receipts.
Monetary Situation

During the first three months of FY 2024/25, Nepal’s broad money (M2) grew by 3.4%, slightly higher than the 3.0% growth in the same period last year, with a year-on-year increase of 13.3% by mid-October 2024. Net foreign assets (NFA), adjusted for exchange valuation effects, rose by Rs.184.99 billion (9.3%), compared to a 7.0% rise in the previous year. Reserve money increased 4.5%, reversing the 2.3% decline observed in last year’s corresponding period.
Domestic credit grew by 1.7% during the review period, maintaining the same growth rate as the previous year, with a year-on-year increase of 6.1%. Claims on the private sector rose by 2.8%, while net claims on the government decreased by 3.3%.

Deposits at banks and financial institutions (BFIs) increased by Rs.170 billion (2.6%) during the review period, slightly lower than the 2.8% rise in the same period last year, but with a year-on-year growth of 12.8%. By mid-October 2024, fixed deposits constituted 54.8% of total deposits, followed by savings (32.7%) and demand deposits (5.4%). Institutional deposits accounted for 35.8% of total deposits.
Credit Disbursement
In the first three months of FY 2024/25, private sector credit from banks and financial institutions (BFIs) increased by Rs.128.65 billion (2.5%), with a year-on-year growth of 6%. Of the total credit, 64% went to non-financial corporations and 36% to households. Commercial banks, development banks, and finance companies saw credit increases of 2.5%, 2.4%, and 3.9%, respectively.
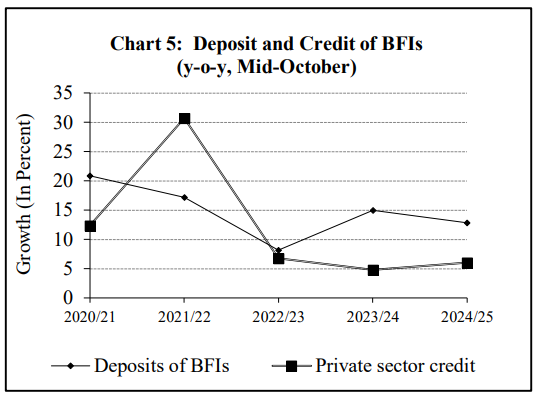
As of mid-October 2024, 13.4% of credit was secured by current assets, while 65.8% was backed by land and buildings. Key sectors like industrial production, construction, wholesale, and services saw credit growth, while agriculture decreased by 0.4%. Term loans grew by 2.7%, and real estate loans increased by 1.5%, while overdraft loans fell by 5.8%.
Liquidity Management
In the review period, Nepal Rastra Bank (NRB) absorbed liquidity of Rs.7833.40 billion, with Rs.590.55 billion through deposit collection auctions and Rs.7242.85 billion through the Standing Deposit Facility (SDF). In the previous year, NRB injected Rs.363.45 billion into the market.
NRB also injected Rs.196.79 billion through the net purchase of USD 1.47 billion, compared to Rs.166.54 billion injected via USD 1.26 billion in the same period last year. Additionally, NRB purchased Indian currency (INR) worth Rs.115.66 billion by selling USD 822 million.
Interbank transactions during the review period totaled Rs.402.45 billion, including Rs.371.25 billion between commercial banks. This was a significant decrease from Rs.1494.08 billion in the previous year, which included Rs.1309.73 billion among commercial banks.
Interest Rate
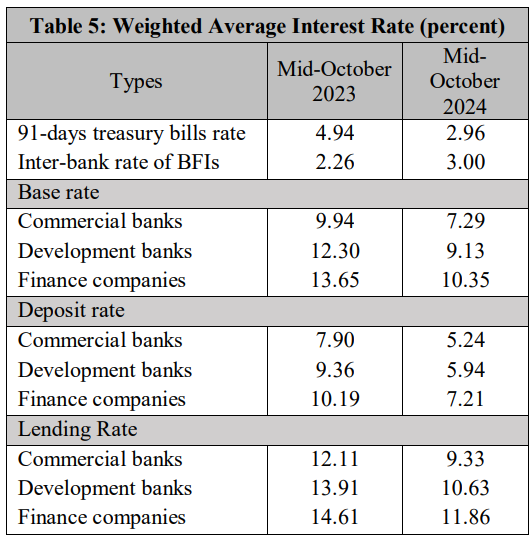
- The 91-day treasury bills rate decreased to 2.96% in the third month of 2024/25, down from 4.94% in the same month of the previous year.
- The inter-bank rate among BFIs rose to 3.00%, compared to 2.26% a year ago.
- The base rates of commercial banks, development banks, and finance companies were 7.29%, 9.13%, and 10.35% respectively, down from 9.94%, 12.30%, and 13.65% in the previous year.
- The weighted average deposit rates were 5.24% for commercial banks, 5.94% for development banks, and 7.21% for finance companies, all lower than last year’s rates of 7.90%, 9.36%, and 10.19% respectively.
- The weighted average lending rates stood at 9.33% for commercial banks, 10.63% for development banks, and 11.86% for finance companies, down from 12.11%, 13.91%, and 14.61% respectively in the previous year.
Financial Access

As of mid-October 2024, there were a total of 107 Banks and Financial Institutions (BFIs) licensed by Nepal Rastra Bank (NRB). This included 20 commercial banks, 17 development banks, 17 finance companies, 52 microfinance financial institutions, and 1 infrastructure development bank. The number of BFI branches increased slightly, reaching 11,539, up from 11,530 in mid-July 2024, indicating a small growth in financial access across the country.
Capital Market

As of mid-October 2024, the NEPSE index stood at 2742.89, a significant increase from 1864.62 in mid-October 2023. The stock market capitalization reached Rs.4361.45 billion, up from Rs.2861.52 billion in the previous year. The number of companies listed on the NEPSE increased to 267, up from 263 in mid-October 2023. Of these, 129 are banks, financial institutions, and insurance companies, 91 are hydropower companies, and the remaining are in various sectors such as manufacturing, processing, hotels, investment, and trading. As of mid-October 2024, the share of banks, financial institutions, and insurance companies in market capitalization was 59.2%, while hydropower companies held 14.7%, and investment companies had 7.9%. The total paid-up value of the 8.39 billion shares listed at NEPSE amounted to Rs.832.09 billion. In the first three months of FY 2024/25, securities worth Rs.5.15 billion were listed, including bonus shares, right shares, and FPOs. The Securities Board of Nepal also approved public issuances worth Rs.4.76 billion, consisting of right shares and mutual funds.
PDF: Current-Macroeconomic-and-Financial-Situation-English-Based-on-Three-Months-data-of-2024.25-1


