
Blogs
Sanima Reliance Life Insurance Company Reports Steady Q2 Performance in FY 2081/82

Sanima Reliance Life Insurance Company Limited (SRLI) has announced its financial results for the second quarter of the fiscal year 2081/82, showcasing a 5.44% increase in net profit. The company reported a net profit of Rs. 23.16 crores, up from Rs. 21.97 crores in the same period last year. Despite rising expenses, SRLI maintained stable financial performance, reflecting its resilience and effective management. Below is a detailed breakdown of its performance:
1. Key Financial Highlights
- Net Profit: Increased by 5.44% to Rs. 23.16 crores (up from Rs. 21.97 crores in Q2 of FY 2080/81).
- Net Premiums: Grew by 18.73% to Rs. 3.11 Arba.
- Income from Investments, Loans, and Other Activities: Generated Rs. 79.26 crores, contributing to overall revenue.
2. Financial Position
- Paid-up Capital: Stood at Rs. 4.95 Arba.
- Reserves:
- Retained Earnings: Rs. 50.84 crores.
- Other Equity: Rs. 6.93 crores.
- Catastrophe Reserves: Rs. 13.43 crores.
3. Expenses
- Net Claims: Increased by 24.92% to Rs. 3.17 Arba.
- Commission Expenses: Rose by 7.85% to Rs. 31.05 crores.
Despite these rising costs, SRLI managed to maintain profitability, showcasing its ability to balance growth and expense management.
4. Key Financial Indicators
- Earnings Per Share (EPS): Annualized EPS stood at Rs. 9.36, reflecting the company’s profitability.
- Net Worth Per Share: Rs. 114.38, indicating the value of each share based on the company’s net assets.
- Price-to-Earnings (P/E) Ratio: 44.57, suggesting the stock’s valuation relative to its earnings.
Comparison of Key Financial Highlights for Q2 of FY 2081/82 and the Previous Fiscal Year
Conclusion
Despite a notable increase in net claims and commission expenses, SRLI managed to boost its net profit by 5.44% and maintain a strong financial position. With a solid base of paid-up capital and reserves, along with healthy growth in net premiums and stable key indicators like EPS and net worth per share, the company remains well-positioned for future challenges and opportunities.

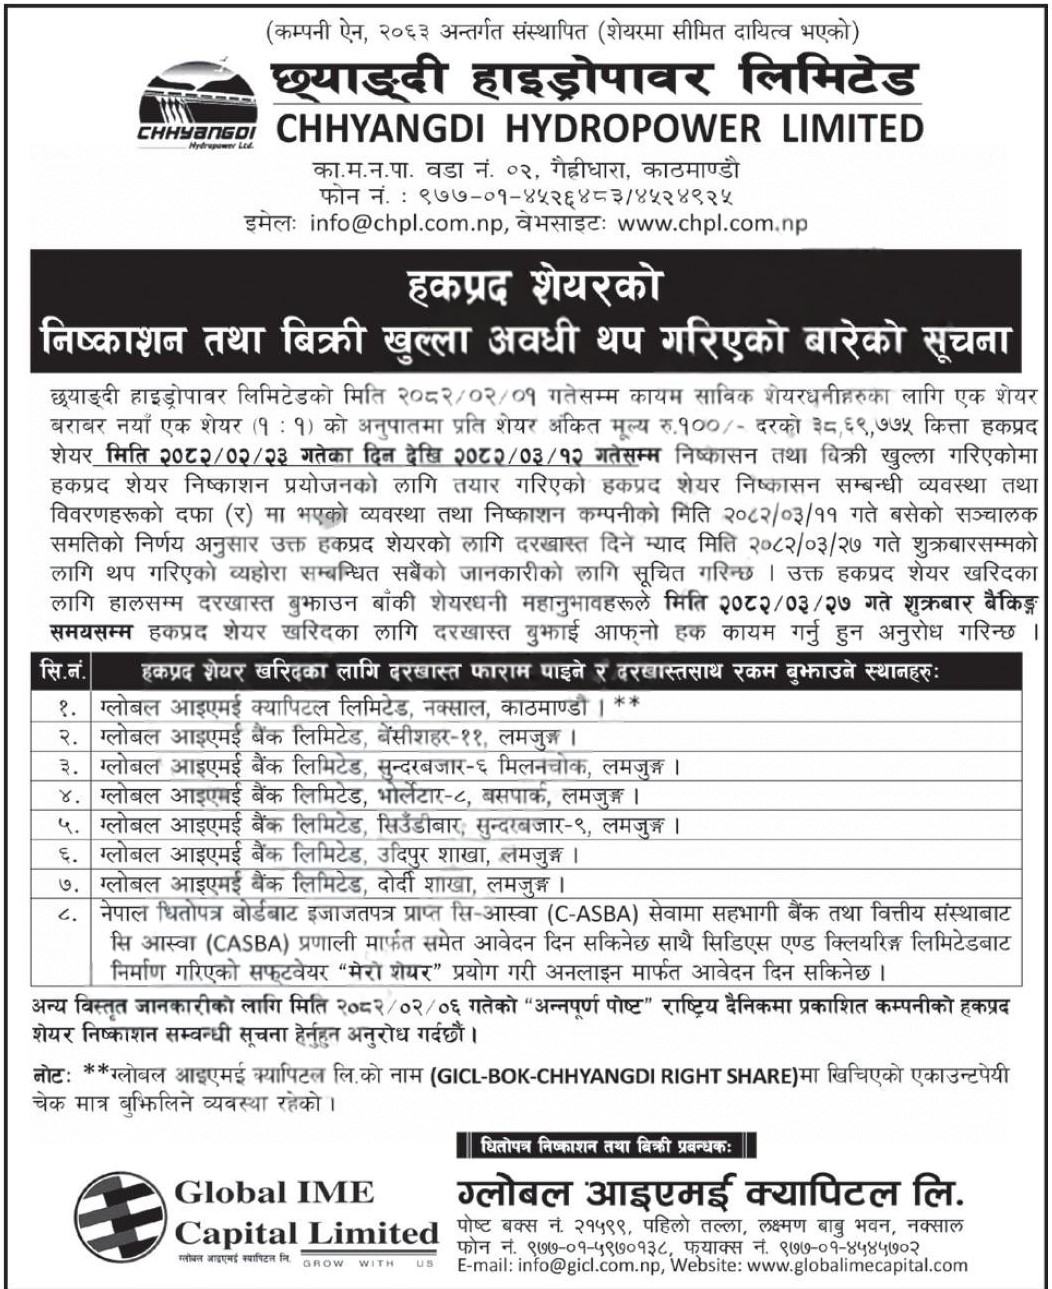
The deadline for the ongoing rights share issue of Chhyangdi Hydropower Limited (CHL) has been officially extended until 27th Ashad, 2082. The issue had originally opened on 23rd Jestha, 2082, with an earlier closing date set for 12th Ashad, 2082.
Key Details of the Rights Share Issue
| Details | Information |
|---|---|
| Total Right Shares Issued | 3,869,775 units (1:1 ratio) |
| Face Value per Share | Rs. 100 |
| Total Issue Amount | Rs. 38.69 Crore |
| Current Paid-up Capital | Rs. 38.69 Crore |
| Post-Issue Paid-up Capital | Rs. 77.39 Crore |
As per the Central Depository System and Clearing Limited (CDSC), 23,503 applicants have applied for 2,317,902 units (worth Rs. 23.17 Crore) as of yesterday.
Eligibility and Application Process
Only those shareholders who held shares before the book closure date of 2nd Jestha, 2082, are eligible for this right share offering.
Interested shareholders can apply through:
- Global IME Capital Limited, Naxal, Kathmandu (Issue Manager)
- Designated branches of Global IME Bank Limited across Lamjung, including Besisahar, Sundarbazar, Bhulbhule, Siundibar, Udipur, and Dordhi
- Any C-ASBA-approved banks and financial institutions
- Online via “MeroShare”.
Applicants are advised to complete the process before banking hours on 27th Ashad, 2082 (Friday).
Important Note:
Payments must be made through an account payee cheque drawn in the name “GICL-BOK-CHHYANGDI RIGHT SHARE”, as per the instructions from Global IME Capital Ltd.
Contact Information
- Chhyangdi Hydropower Ltd
Phone: 977-01-4526483 / 4524925
Email: [email protected] | Website: www.chpl.com.np - Global IME Capital Ltd (Issue Manager)
Phone: 977-01-5970138
Email: [email protected] | Website: www.globalimecapital.com
Notice: Chhyangdi Hydropower Extends Deadline for Rights Share Application
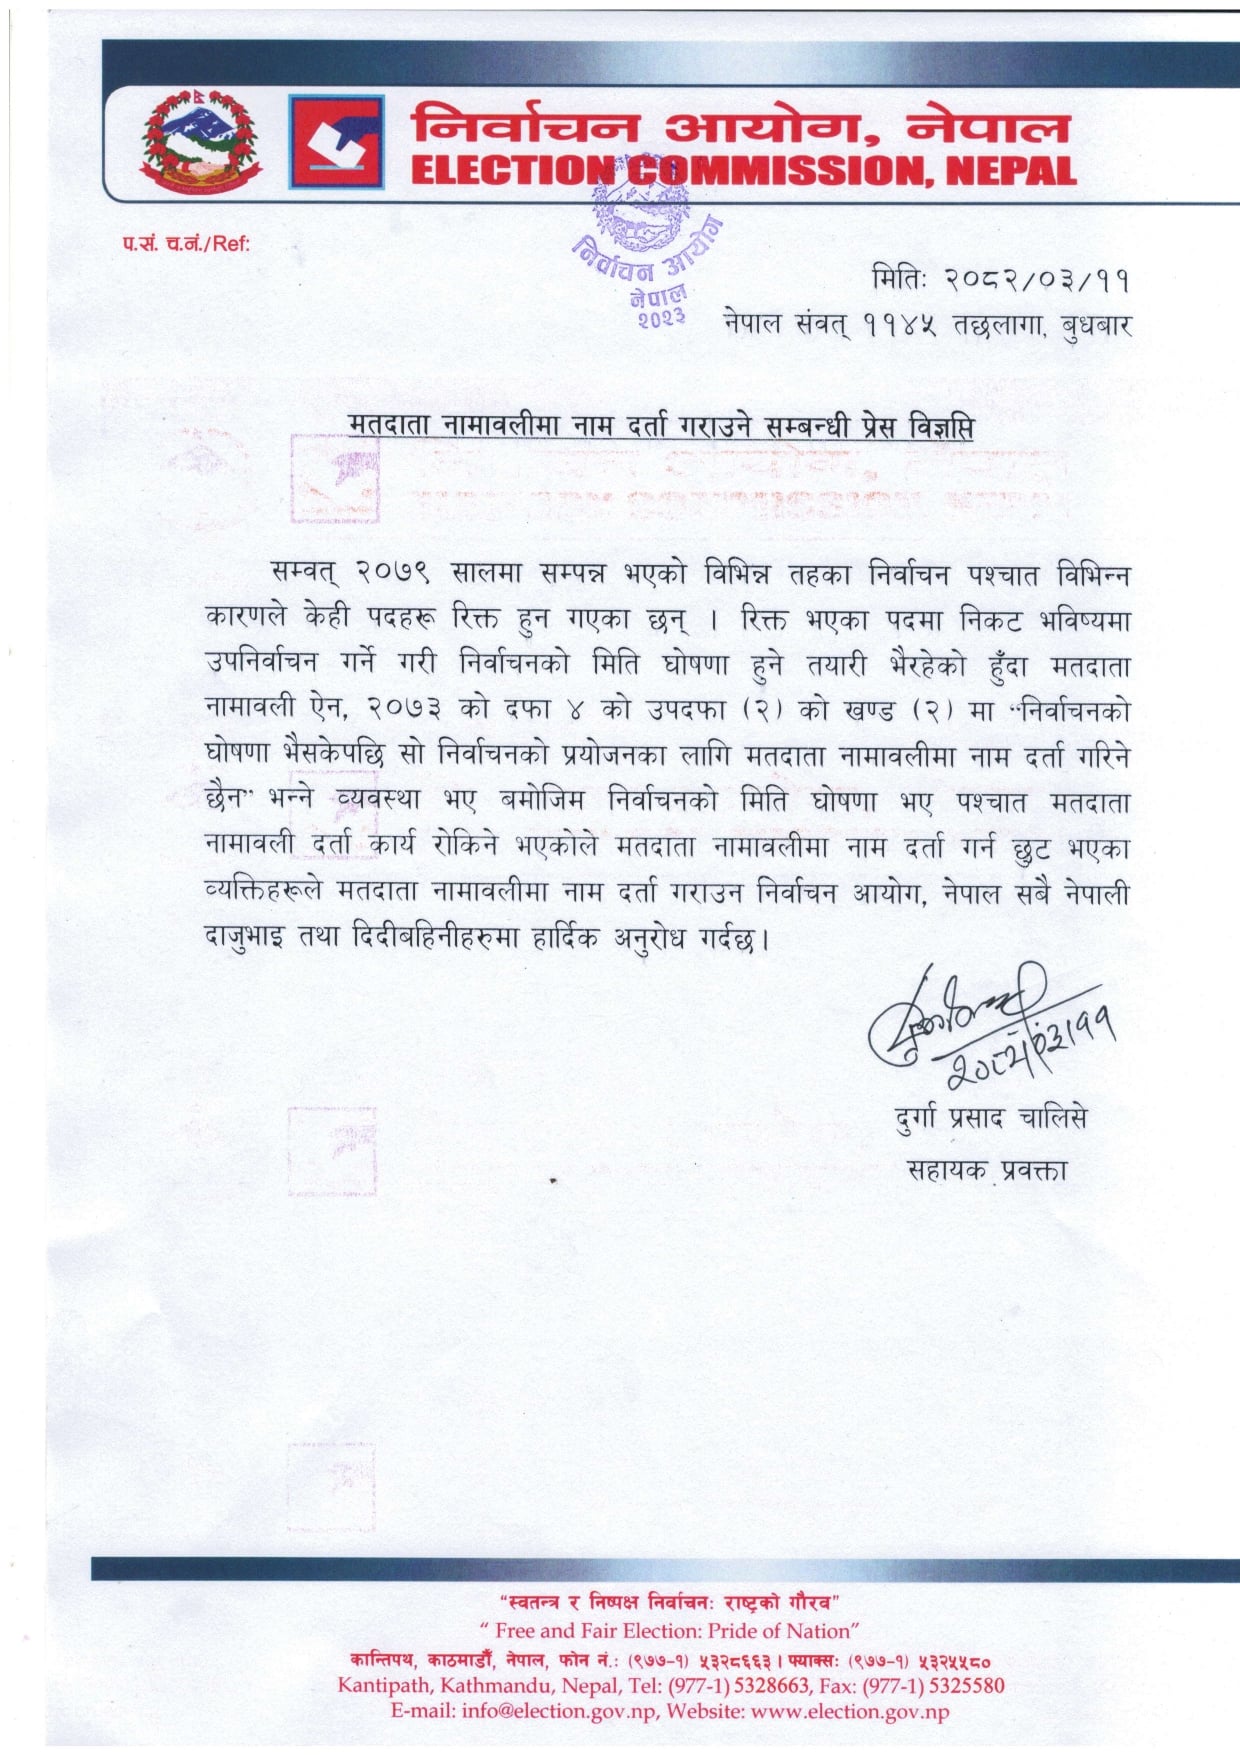
The Election Commission of Nepal has begun preparations for by-elections to fill vacant positions at various levels of government. As part of this process, the Commission is urging all eligible Nepali citizens who have not yet registered their names in the voter list to do so immediately.
According to the Assistant Spokesperson of the Election Commission, Mr. Durga Prasad Chalise, individuals will not be allowed to register in the voter list once the election date is officially announced. Therefore, he emphasized the importance of early registration to avoid being left out.
The Election Commission recently held discussions with the Prime Minister, Mr. KP Sharma Oli, and the Acting Chief Election Commissioner, Mr. Ram Prasad Bhandari. They talked about setting a date for the by-elections. The main focus was on two key areas: Rupandehi Constituency No. 3 for the House of Representatives and Manang Province Assembly Constituency No. 1 (B). Elections in these regions are likely to be held in the second week of Kartik.
The position in Rupandehi became vacant after the passing of Rastriya Prajatantra Party MP Deepak Bohora. In Manang, the seat became empty after provincial assembly member Deepak Manange was sent to jail. In addition to these, more than a dozen ward chairman positions are also currently unoccupied in various local governments.
The Election Commission has issued a public notice dated 2082/03/11 (Nepali calendar) urging all citizens to register in the voter list immediately. The notice mentions that, according to Clause 4(2)(2) of the Voter List Act, 2073, voter registration will be stopped as soon as the election date is declared.
Hence, this is a final chance for anyone who missed earlier opportunities to register. The Commission has made a heartfelt appeal to all brothers and sisters across the country to take this opportunity seriously and get their names included in the voter list.
The Election Commission assures that the upcoming elections will be conducted fairly and freely, in line with its guiding principle:
“Free and Fair Election: Pride of the Nation.”
For more information or assistance, people can visit the official website of the Election Commission at www.election.gov.np or contact their office at Kantipath, Kathmandu.
Notice: Election Commission Preparing to Announce By-Election Date
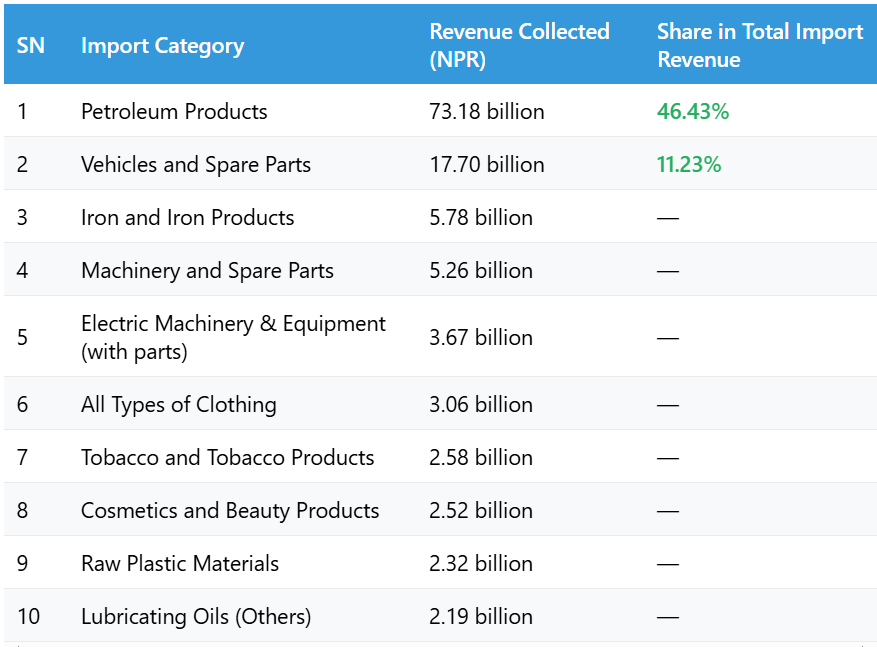
The Birgunj Customs Office has collected the highest revenue from the import of petroleum products in the first 11 months of the current fiscal year 2081/82. According to the office, a total of NPR 73.18 billion was collected in revenue from petroleum imports alone.
During this period, Nepal spent about NPR 174.09 billion to import five different types of petroleum products. These petroleum imports contributed 46.43% of the total revenue collected from the top 20 imported items, making it the most important source of income for the customs office.
Major Revenue Contributors from Imports
What Officials Say
Customs Chief Administrator Deepak Lamichhane stated that petroleum products and vehicle imports are the main sources of customs revenue at Birgunj. He highlighted that these two sectors consistently contribute the highest share of government income collected through imports.
Conclusion
The data from the Birgunj Customs Office shows that fuel and vehicles remain Nepal’s most heavily imported and taxed items. With more than 46% of the revenue coming from petroleum alone, any changes in fuel prices or import volumes can significantly affect national customs revenue.


Chhyangdi Hydropower Extends Deadline for Rights Share Application | Until 27th Ashad
Election Commission Preparing to Announce By-Election Date | Voter Registration Now Open

Birgunj Customs Office Collects Highest Revenue from Petroleum Imports

Private Power Producers Protest ‘Take and Pay’ Provision in Budget

Nepal Rastra Bank to Withdraw NPR 60 Billion from the Banking System on Monday
List of Stock Brokers in Nepal with NEPSE TMS Login – Updated
-
 Blogs4 days ago
Private Power Producers Protest ‘Take and Pay’ Provision in Budget
-
 Blogs4 days ago
Nepal Rastra Bank to Withdraw NPR 60 Billion from the Banking System on Monday
-
 Blogs1 year ago
List of Stock Brokers in Nepal with NEPSE TMS Login – Updated
-
 Blogs1 week ago
Hydropower Gains 7.8% in One Month, Outperforming All Sectors
-
 Blogs4 days ago
Asian Life Insurance to Issue Rights Shares from Asar 25
-
 Blogs3 months ago
Pure Energy IPO For General Public
-

 Blogs4 days ago
52-Week Low & High Microfinance Shares in Nepal: Current Status and Future Outlook
-
 Blogs1 week ago
Banks Invest Rs. 16.45 Trillion in Directed Loans, 14% in Agriculture Sector | Says Nepal Rastra Bank