
Blogs
Monthly Report of Mutual Funds For Chaitra

Mutual funds have become a popular investment choice in Nepal, offering individuals a way to invest in a diversified portfolio without directly buying stocks or bonds. Currently, the Nepal Stock Exchange (NEPSE) lists 35 closed-end mutual funds, which trade like regular stocks. Additionally, there are 8 open-end mutual fund schemes, but these are bought and sold directly through fund managers rather than on the exchange.
Two new funds MBL Equity Fund (MBLEF) and Garima Samriddhi Yojana (GSY) have recently opened for public investment. Once they get listed on NEPSE, the total number of mutual fund schemes will increase to 45, giving investors more options.
Where Are Mutual Funds Investing?
In Chaitra 2081, mutual funds in Nepal had a total investment of Rs. 43.37 Arba in listed and unlisted companies. This is slightly lower than the previous month (Falgun 2081), when the investment stood at Rs. 44.02 Arba.
Here’s a closer look at their investment breakdown:
- Bank Deposits: Mutual funds held Rs. 8.49 Arba in bank balances in Chaitra, down from Rs. 9.17 Arba in Falgun.
- Debentures & Bonds: Investments in debentures and bonds amounted to Rs. 2.72 Arba.
- Primary Shares & Rights: Mutual funds allocated 2.49% of their investments (around Rs. 1.46 Arba) in primary shares and rights issues.
This data highlights how mutual funds spread their investments to balance risk and returns. While they mainly invest in stocks, they also keep funds in safer options like bank deposits and bonds.
| S.N. | Particulars | Chaitra 2081 (Rs.) | % of Overall (MF) in Chaitra | Falgun 2081 (Rs.) | % of Overall (MF) in Falgun | Magh 2081 (Rs.) | % of Overall (MF) in Magh |
|---|---|---|---|---|---|---|---|
| 1 | Investment in Listed/Non-listed Shares | 44,020,337,757.00 | 74.78% | 43,379,273,790.69 | 73.26% | 41,409,105,713.76 | 73.64% |
| 2 | Debentures and Bonds | 2,727,062,863.19 | 4.63% | 2,714,924,633.13 | 4.59% | 2,682,653,216.94 | 4.77% |
| 3 | IPO/FPO/Right/Bonus Share Investment | 1,464,449,580.09 | 2.49% | 1,886,755,332.98 | 3.19% | 2,030,192,571.59 | 3.61% |
| 4 | Fixed Income Instruments | 2,164,083,452.12 | 3.68% | 2,055,258,624.79 | 3.47% | 1,696,901,042.38 | 3.02% |
| 5 | Bank Balance | 8,493,484,407.15 | 14.43% | 9,176,338,095.00 | 15.50% | 8,415,682,564.35 | 14.97% |
Mutual Funds Top Investments in the Month of Chaitra, Irrespective of Sectors
| S.N. | Symbol | No. of Shares | Price (Rs.) | Value of Shares (Rs.) | NAV Change Factor (Rs.) |
|---|---|---|---|---|---|
| 1 | SPIL | 1,425,058 | 837.58 | 1,248,152,370.66 | 0.0228 |
| 2 | NLICL | 1,997,747 | 624.78 | 1,193,600,079.64 | 0.0213 |
| 3 | NIL | 1,578,759 | 750.76 | 1,185,269,106.84 | 0.0217 |
| 4 | CBBL | 1,366,576 | 844.44 | 1,153,991,437.44 | 0.0212 |
| 5 | EBL | 1,903,618 | 606.10 | 1,153,782,869.80 | 0.0218 |
| 6 | SALICO | 1,599,023 | 716.61 | 1,145,875,872.03 | 0.0208 |
| 7 | SANIMA | 3,755,968 | 300.90 | 1,130,170,771.20 | 0.0211 |
| 8 | NLIC | 1,249,645 | 766.41 | 957,740,424.45 | 0.0177 |
| 9 | SKBBL | 1,181,704 | 799.62 | 944,914,152.48 | 0.0173 |
| 10 | GBBL | 2,346,143 | 395.86 | 928,744,167.98 | 0.0170 |
Most Bought Stocks By Mutual Funds in Chaitra
| S.N. | Symbol | Buy Quantity | Latest Holdings |
|---|---|---|---|
| 1 | GSY | 7,906,100.00 | 8,406,100.00 |
| 2 | PCBL | 578,572.00 | 2,713,780.00 |
| 3 | NMBHF2 | 500,000.00 | 500,000.00 |
| 4 | H8020 | 400,994.00 | 3,599,922.00 |
| 5 | SHIVM | 360,480.00 | 1,557,441.00 |
| 6 | NIFRA | 339,691.00 | 830,979.00 |
| 7 | GBBL | 307,940.00 | 2,346,143.00 |
| 8 | NMB | 301,794.00 | 2,854,324.00 |
| 9 | HIDCLP | 292,122.00 | 1,735,106.00 |
| 10 | KSBBL | 287,554.00 | 1,380,815.00 |
Most Sold Stocks By the Mutual Fund Sector in Chaitra
| S.N. | Symbol | Sales Quantity | Latest Holdings |
|---|---|---|---|
| 1 | SAGF | 2,000,000.00 | 6,604,850.00 |
| 2 | PRSF | 1,479,900.00 | 8,252,467.00 |
| 3 | KEF | 1,192,541.00 | 2,621,590.00 |
| 4 | NIBLSTF | 815,522.00 | 21,877,694.00 |
| 5 | ICFC | 773,338.00 | 189,536.00 |
| 6 | KSY | 553,478.00 | 17,949,022.00 |
| 7 | RMF1 | 500,000.00 | 6,035,262.00 |
| 8 | MNMF1 | 397,000.00 | 3,052,800.00 |
| 9 | RADHI | 275,207.00 | 173,586.00 |
| 10 | NBF2 | 250,000.00 | 2,206,359.00 |
Sector-Wise Investment Trends of Mutual Funds in Nepal
Mutual funds in Nepal have strategically allocated their investments across various sectors, with clear preferences emerging in their portfolio holdings. As of Chaitra 2081, their investments reveal which industries are attracting the most capital and how fund managers are diversifying risk.
Top Sector Investments
-
Commercial Banking (20.70%) – Mutual funds have the highest exposure to commercial banks, investing Rs. 9.11 Arba in this sector. This dominance reflects the stability and growth potential of Nepal’s banking industry.
-
Non-Life Insurance (13.91%) – The second-largest allocation is in non-life insurance companies, with investments worth Rs. 6.12 Arba. This sector has been gaining traction due to increasing insurance penetration in Nepal.
-
Microfinance (13.53%) – Close behind is the microfinance sector, where mutual funds have deployed Rs. 5.95 Arba. Microfinance institutions remain attractive due to their high-interest margins and rural market reach.
Other Sector Allocations
While the above three sectors dominate, mutual funds have also invested smaller amounts in:
-
Manufacturing & Products
-
Promoter Shares
-
Other Emerging Sectors
These allocations indicate a balanced approach prioritizing high-growth industries while maintaining some exposure to niche markets.
| S.N. | Sector | No. of Shares | Total Value (Chaitra 2081) | Sectorwise Weightage (%) |
|---|---|---|---|---|
| 1 | Commercial Bank | 30,031,518.00 | 9,112,328,039.49 | 20.70 |
| 2 | Corporate Debentures | 19,452.00 | 24,865,491.60 | 0.06 |
| 3 | Development Bank | 9,413,917.00 | 3,767,223,965.95 | 8.56 |
| 4 | Finance | 482,173.00 | 283,313,160.97 | 0.64 |
| 5 | Hotel & Tourism | 1,214,634.00 | 818,317,365.45 | 1.86 |
| 6 | Hydropower | 10,144,625.00 | 4,197,382,223.70 | 9.53 |
| 7 | Investment | 1,633,090.00 | 1,540,041,027.91 | 3.50 |
| 8 | Life Insurance | 8,899,800.00 | 5,541,712,878.05 | 12.59 |
| 9 | Manufacturing and Processing | 2,369,204.00 | 1,860,129,819.84 | 4.23 |
| 10 | Merged | 67,618.00 | 31,434,376.60 | 0.07 |
| 11 | Microfinance | 7,056,697.00 | 5,955,797,478.94 | 13.53 |
| 12 | Mutual Fund | 213,647,849.00 | 1,984,359,268.92 | 4.51 |
| 13 | Non-Life Insurance | 8,009,050.00 | 6,122,643,393.81 | 13.91 |
| 14 | Promoter Share | 3,206,133.00 | 812,359,145.82 | 1.85 |
| 15 | Others | 1,706,117.00 | 1,788,459,144.31 | 4.06 |
| 16 | Trading | 35,921.00 | 185,184,968.14 | 0.42 |
Top Commercial Bank Investments by Mutual Funds in Nepal
Mutual funds in Nepal are heavily invested in commercial banks of Nepal, with Everest Bank (EBL) leading at Rs. 1.15 Arba, followed closely by Sanima Bank (SANIMA) at Rs. 1.13 Arba and NIC Asia Bank (NICA) at Rs. 76.52 crores. These allocations reflect fund managers’ preference for stable, high-performing banks with strong market positions and growth potential. The substantial investments in these top banks highlight their importance in Nepal’s financial sector and mutual funds’ strategy of balancing security with returns.
| S.N. | Symbol | No. of Share | Total Value as of LTP (Rs.) |
|---|---|---|---|
| 1 | EBL | 1,903,618.00 | 1,153,782,869.80 |
| 2 | SANIMA | 3,755,968.00 | 1,130,170,771.20 |
| 3 | NICA | 2,034,909.00 | 765,207,180.36 |
| 4 | NMB | 2,854,324.00 | 716,806,386.12 |
| 5 | PCBL | 2,713,780.00 | 678,472,137.80 |
| 6 | SBL | 2,364,247.00 | 669,956,672.39 |
| 7 | SCB | 934,163.00 | 588,018,241.98 |
| 8 | MLB | 2,073,136.00 | 468,300,691.04 |
| 9 | SBI | 936,215.00 | 394,024,807.05 |
| 10 | GBIME | 1,745,811.00 | 381,791,407.59 |
Mutual Fund Investments in Development Banks
Among development banks, Garima Bikas Bank (GBBL) leads with mutual fund investments worth Rs. 92.87 crores, reflecting strong institutional confidence. Shine Resunga Development Bank (SHINE) follows closely with Rs. 61.77 crores, while Muktinath Bikas Bank (MNBBL) ranks third at Rs. 60.73 crores. These allocations highlight mutual funds’ focus on stable, high-growth development banks in Nepal’s evolving financial sector.
| S.N. | Symbol | No. of Shares | Total Value as of LTP (Rs.) |
|---|---|---|---|
| 1 | GBBL | 2,346,143.00 | 928,744,167.98 |
| 2 | SHINE | 1,519,154.00 | 617,703,207.94 |
| 3 | MNBBL | 1,684,424.00 | 607,319,073.20 |
| 4 | KSBBL | 1,380,815.00 | 603,788,975.05 |
| 5 | LBBL | 1,010,416.00 | 425,799,406.56 |
| 6 | SADBL | 679,329.00 | 271,120,203.90 |
| 7 | MLBL | 408,268.00 | 158,648,862.12 |
| 8 | JBBL | 292,486.00 | 97,547,005.86 |
| 9 | MDB | 92,882.00 | 56,553,063.34 |
Mutual Fund Investments in Finance Companies
In Nepal’s finance sector, Manjushree Finance Limited (MFIL) leads with mutual fund investments worth Rs. 14.05 crores, followed by ICFC Finance Limited (ICFC) at Rs. 11.26 crores. These allocations demonstrate mutual funds’ strategic focus on established finance companies in Nepal with strong market presence and growth potential.
| S.N. | Symbol | No. of Shares | Total Value as of LTP (Rs.) |
|---|---|---|---|
| 1 | MFIL | 234,430.00 | 140,510,309.10 |
| 2 | ICFC | 189,536.00 | 112,648,826.24 |
| 3 | JFL | 22,000.00 | 11,038,720.00 |
| 4 | GMFIL | 14,760.00 | 7,403,468.40 |
| 5 | SIFC | 12,377.00 | 6,510,178.23 |
| 6 | GUFL | 8,170.00 | 4,738,600.00 |
| 7 | RLFL | 900.00 | 463,059.00 |
Mutual Funds’ Hotel Sector Investments
Within Nepal’s tourism sector, Soaltee Hotel Limited (SHL) leads mutual fund investments with Rs. 34.58 crores allocated – the highest among six listed hospitality companies. This substantial investment highlights institutional confidence in SHL’s market leadership and the recovery potential of Nepal’s tourism industry.
| S.N. | Symbol | No. of Shares | Total Value as of LTP (Rs.) |
|---|---|---|---|
| 1 | SHL | 702,196.00 | 345,852,595.88 |
| 2 | CGH | 281,919.00 | 240,479,726.19 |
| 3 | TRH | 162,474.00 | 172,094,085.54 |
| 4 | OHL | 50,847.00 | 44,554,175.28 |
| 5 | CITY | 13,698.00 | 11,516,182.56 |
| 6 | KDL | 3,500.00 | 3,820,600.00 |
Hydropower Sector: Mutual Fund Investment Trends
Mutual funds have shown strong interest in Nepal’s hydropower sector, with Mountain Energy Nepal Limited (MEN) attracting the highest investment at Rs. 67.78 crores. Following closely are Sanima Mai Hydropower (SHPC) with Rs. 46.91 crores and Api Power Company (API) with Rs. 39.54 crores in mutual fund allocations.
These strategic investments highlight:
-
Confidence in MEN’s growth potential and project pipeline
-
Significant exposure to established players like SHPC
-
Balanced portfolio approach with API’s inclusion
The allocations reflect mutual funds’ long-term outlook on Nepal’s energy sector and its role in the nation’s economic development.
| S.N. | Symbol | No. of Shares | Total Value as of LTP (Rs.) |
|---|---|---|---|
| 1 | MEN | 1,161,277.00 | 677,814,159.36 |
| 2 | SHPC | 987,957.00 | 469,190,658.87 |
| 3 | API | 1,447,954.00 | 395,421,757.86 |
| 4 | SAHAS | 781,589.00 | 391,810,565.70 |
| 5 | CHCL | 605,076.00 | 287,459,506.08 |
| 6 | TAMOR | 341,673.00 | 179,292,906.75 |
| 7 | NHPC | 606,902.00 | 151,567,705.48 |
| 8 | PHCL | 221,617.00 | 128,712,937.43 |
| 9 | AKPL | 542,119.00 | 122,849,586.59 |
| 10 | RURU | 126,691.00 | 90,414,299.06 |
Mutual Fund Investments in the Life Insurance Sector
Nepal’s life insurance sector has attracted significant mutual fund investments, with National Life Insurance Company (NLICL) leading at Rs. 1.24 Arba. Close behind are industry stalwarts Nepal Life Insurance (NLIC) with Rs. 95.77 crores and Asian Life Insurance (ALICL) with Rs. 68.90 crores in mutual fund allocations.
| S.N. | Symbol | No. of Shares | Total Value as of LTP (Rs.) |
|---|---|---|---|
| 1 | NLICL | 1,997,747.00 | 1,248,152,370.66 |
| 2 | NLIC | 1,249,645.00 | 957,740,424.45 |
| 3 | ALICL | 929,937.00 | 689,083,317.00 |
| 4 | HLI | 1,437,944.00 | 609,271,252.24 |
| 5 | LICN | 438,938.00 | 427,183,240.36 |
| 6 | SJLIC | 792,680.00 | 348,628,590.80 |
| 7 | SNLI | 472,673.00 | 302,737,603.04 |
| 8 | GMLI | 101,403.00 | 251,149,880.25 |
| 9 | RNLI | 412,332.00 | 220,082,205.00 |
| 10 | CLI | 409,638.00 | 203,778,519.48 |
Mutual Funds’ Investment in Manufacturing and Products:
Nepal’s manufacturing sector has attracted notable mutual fund investments, with Shivam Cements (SHIVM) leading at Rs. 81.17 crore, followed by Himalayan Distillery (HDL) at Rs. 31.64 crore and Unilever Nepal (UNL) at Rs. 26.91 crore as of Chaitra 2081.
| S.N. | Symbol | No. of Shares | Total Value as of LTP (Rs.) |
|---|---|---|---|
| 1 | SHIVM | 1,557,441.00 | 811,753,823.61 |
| 2 | HDL | 264,678.00 | 316,417,255.44 |
| 3 | UNL | 5,776.00 | 269,179,505.60 |
| 4 | SARBTM | 331,199.00 | 261,484,922.49 |
| 5 | BNT | 8,001.00 | 104,981,121.00 |
| 6 | SONA | 170,918.00 | 79,844,343.70 |
| 7 | GCIL | 31,191.00 | 16,468,848.00 |
Mutual Funds’ Microfinance Sector Investments (Chaitra 2081)
Microfinance Companies in Nepal are the key sectors in investment for mutual funds, with Chhimek Laghubitta (CBBL) leading investments at Rs. 1.15 Arba, followed by Sana Kisan Laghubitta (SKBBL) at Rs. 94.49 Crores and Nirdhan Utthan Laghubitta (NUBL) at Rs. 83.32 Crores.
Sector Breakdown:
-
CBBL Dominance: Commands 39% of the top three MFI investments
-
Rural Focus: SKBBL and NUBL allocations show strong rural penetration strategies
-
Total Exposure: Combined Rs. 2.93 Arba in top three reflects sector importance
| S.N. | Symbol | No. of Shares | Total Value as of LTP (Rs.) |
|---|---|---|---|
| 1 | CBBL | 1,366,576.00 | 1,153,991,437.44 |
| 2 | SKBBL | 1,181,704.00 | 944,914,152.48 |
| 3 | NUBL | 1,242,712.00 | 833,288,104.48 |
| 4 | NMFBS | 234,556.00 | 289,017,557.64 |
| 5 | FOWAD | 244,838.00 | 284,014,528.38 |
| 6 | FMDBL | 347,218.00 | 264,132,204.78 |
| 7 | DDBL | 316,730.00 | 245,829,989.50 |
| 8 | SWBBL | 289,703.00 | 241,032,896.00 |
| 9 | GILB | 183,039.00 | 226,635,229.02 |
| 10 | SLBBL | 170,290.00 | 163,495,429.00 |
Mutual Funds Investing in Other Mutual Funds
Nepal’s mutual funds show strategic cross-investments, with NIBL Stable Fund (NIBLSTF) leading at Rs. 19.4 crore, followed by Sunrise Focused Equity Fund (SFEF) at Rs. 17.38 crore and NIC Asia Growth Fund 2 (NICGF2) at Rs. 16.99 crore. These allocations reflect professional fund managers’ preference for stable debt (NIBLSTF), focused equity (SFEF), and growth-oriented (NICGF2) strategies, demonstrating portfolio diversification and confidence in peer schemes.
| S.N. | Symbol | No. of Shares | Total Value as of LTP (Rs.) |
|---|---|---|---|
| 1 | NIBLSTF | 18,891,594.00 | 194,055,145.78 |
| 2 | SFEF | 21,877,694.00 | 173,802,664.80 |
| 3 | NICGF2 | 19,734,030.00 | 169,909,998.30 |
| 4 | KSY | 17,949,022.00 | 161,541,198.00 |
| 5 | C30MF | 14,514,189.00 | 131,353,410.45 |
| 6 | NIBLGF | 13,417,750.00 | 114,587,585.00 |
| 7 | SIGS3 | 10,549,735.00 | 106,552,323.50 |
| 8 | PRSF | 8,252,467.00 | 84,835,360.76 |
| 9 | GSY | 8,406,100.00 | 75,570,839.00 |
| 10 | LVF2 | 6,881,487.00 | 64,204,273.71 |
Mutual Funds’ Top Non-Life Insurance Picks
Nepal’s non-life insurance sector has attracted substantial mutual fund investments, with Siddhartha Premier Insurance (SPIL) leading at Rs. 1.19 Arba, closely followed by Neco Insurance (NIL) at Rs. 1.18 Arba and Sagarmatha Lumbini Insurance (SALICO) at Rs. 1.14 Arba. These near-identical allocations to the top three insurers reveal:
-
Intense Competition: Mere Rs. 5 crore separates SPIL (1st) and NIL (2nd)
-
Sector Concentration: Combined Rs. 3.51 Arba in top 3 shows heavy institutional focus
-
Growth Potential: Reflects confidence in non-life insurance market expansion
The minimal gaps between these investments suggest that mutual funds view Nepal’s non-life insurers as relatively comparable in terms of risk-reward profiles.
| S.N. | Symbol | No. of Shares | Total Value as of LTP (Rs.) |
|---|---|---|---|
| 1 | SPIL | 1,425,058.00 | 1,193,600,079.64 |
| 2 | NIL | 1,578,759.00 | 1,185,269,106.84 |
| 3 | SALICO | 1,599,023.00 | 1,145,875,872.03 |
| 4 | PRIN | 713,030.00 | 650,511,529.60 |
| 5 | NICL | 478,620.00 | 383,580,426.60 |
| 6 | NLG | 420,264.00 | 371,828,574.00 |
| 7 | IGI | 520,057.00 | 293,905,012.98 |
| 8 | SICL | 275,318.00 | 209,896,936.84 |
| 9 | HEI | 355,029.00 | 209,886,044.22 |
| 10 | UAIL | 303,002.00 | 190,954,890.42 |
Mutual Fund Investments in Promoter Shares
Nepal’s mutual funds have strategically invested in promoter shares of select companies, demonstrating confidence in their long-term growth potential. The top investments include:
| S.N. | Symbol | No. of Shares | Total Value as of LTP (Rs.) |
|---|---|---|---|
| 1 | HIDCLP | 1,735,106.00 | 315,303,462.32 |
| 2 | SWBBLP | 140,909.00 | 110,190,838.00 |
| 3 | RBCLPO | 6,769.00 | 81,263,198.80 |
| 4 | NUBLPO | 143,349.00 | 78,841,950.00 |
| 5 | HEIP | 211,630.00 | 76,959,249.50 |
| 6 | NIMBPO | 375,928.00 | 58,231,247.20 |
| 7 | SPILPO | 251,000.00 | 43,925,000.00 |
| 8 | KBLPO | 273,942.00 | 27,394,200.00 |
| 9 | FOWADP | 67,500.00 | 20,250,000.00 |
Mutual Fund Investments in Other Sectors
Mutual funds have invested Rs. 89.46 crore in Himalayan Reinsurance (HRL) and Rs. 41.25 crore in Nepal Telecom (NTC), showing confidence in Nepal’s insurance and telecom growth. These niche investments help diversify portfolios beyond traditional sectors.
| S.N. | Symbol | No. of Shares | Total Value as of LTP (Rs.) |
|---|---|---|---|
| 1 | HRL | 884,574.00 | 894,666,989.34 |
| 2 | NTC | 458,444.00 | 412,526,248.96 |
| 3 | NRIC | 314,433.00 | 410,209,291.80 |
| 4 | MKCL | 36,991.00 | 59,668,702.46 |
| 5 | NWCL | 11,675.00 | 11,387,911.75 |
Mutual Fund Investments in the Investment Sector
Nepal’s mutual funds have allocated Rs. 72.90 crores to Citizen Investment Trust (CIT), making it their top pick in the investment sector, followed by CEDB Hydropower Development Company (CHDC) with Rs. 41.44 crores. These investments reflect confidence in CIT’s stable returns and CHDC’s hydropower growth potential.
| S.N. | Symbol | No. of Shares | Total Value as of LTP (Rs.) |
|---|---|---|---|
| 1 | CIT | 374,986.00 | 729,025,282.04 |
| 2 | CHDC | 162,175.00 | 414,431,725.50 |
| 3 | NIFRA | 830,979.00 | 229,774,003.29 |
| 4 | NRN | 48,679.00 | 85,843,956.13 |
| 5 | HIDCL | 197,948.00 | 57,044,654.64 |
| 6 | HATHY | 11,203.00 | 15,334,330.31 |
| 7 | ENL | 7,120.00 | 8,587,076.00 |
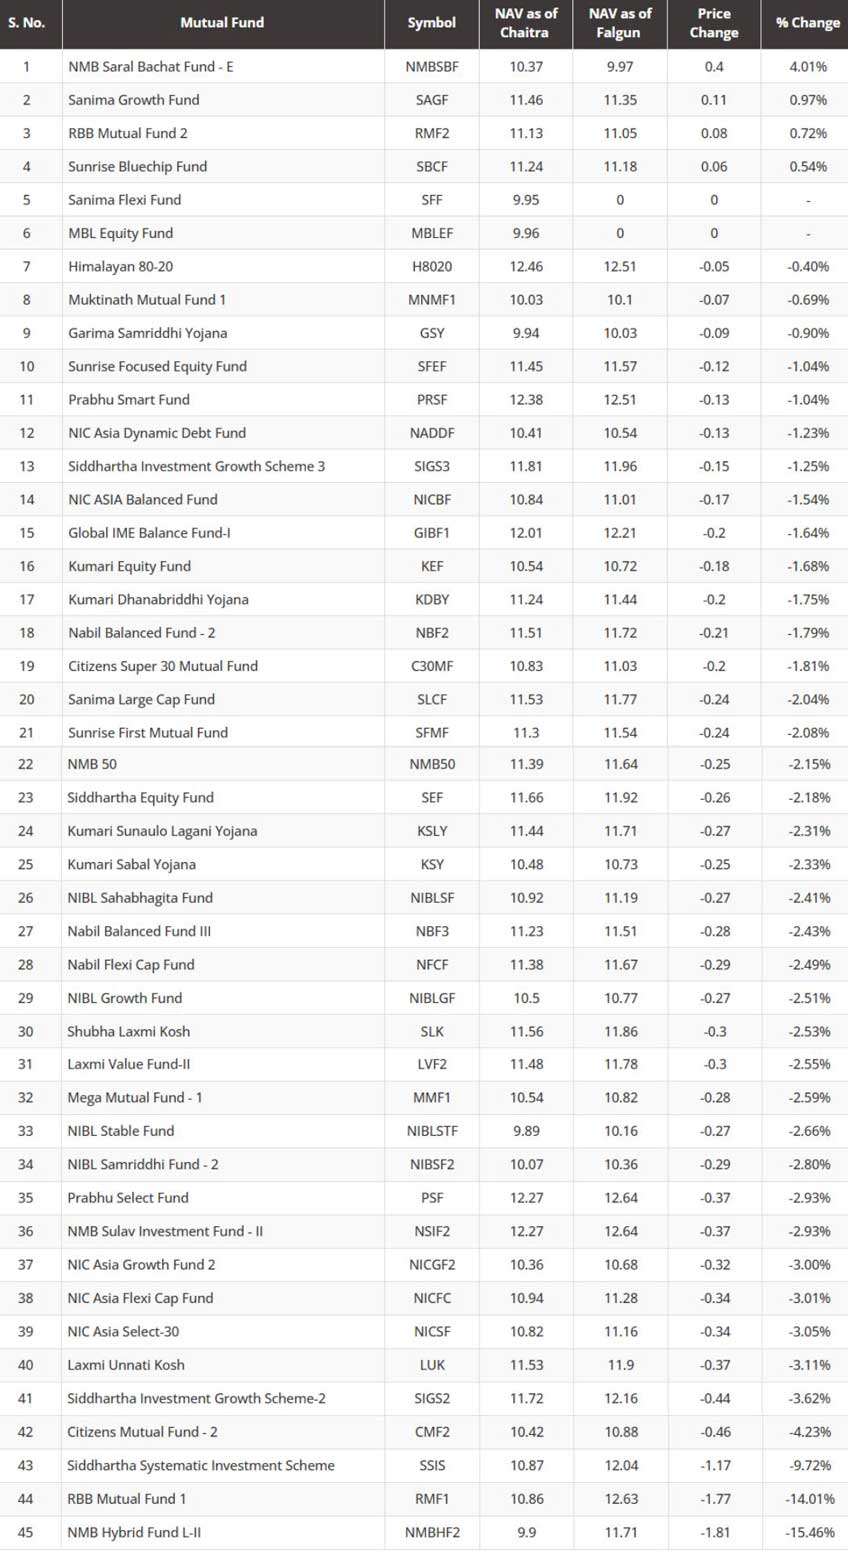
NAV Performance of Mutual Funds in Chaitra 2081
NAV fluctuations varied significantly across funds last month. NMB Saral Bachat Fund-E led with +4.01% growth, reflecting its stable debt focus, while NMB Hybrid Fund L-II dropped -15.46% due to equity market volatility. This 19.47% performance gap highlights how asset allocation drives returns, with debt funds generally offering more stability than equity-oriented schemes during market swings.

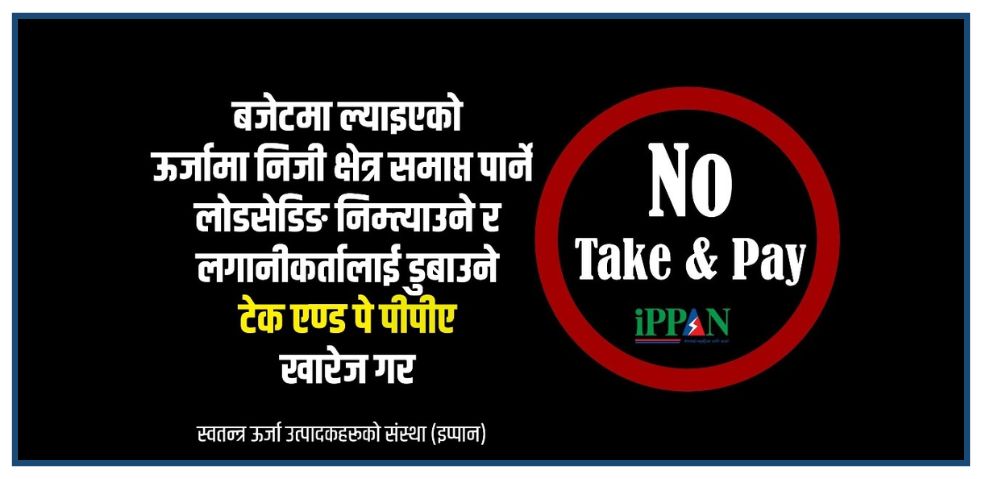
Private energy entrepreneurs in Nepal have taken to social media, protesting the government’s decision to introduce the ‘Take and Pay’ (Liu Ra Tir) system for electricity purchase agreements (PPA) in the new fiscal year budget.
Under this system, the government would only pay for the electricity it uses, instead of paying for the total electricity generated by hydropower projects. Entrepreneurs argue this move could severely hurt the private sector, discourage investment, and push the country back toward power shortages.
Online Campaign Targets Top Officials
Energy producers are now directly appealing to key government figures. They have publicly tagged Prime Minister Pushpa Kamal Dahal, Finance Minister Barshaman Pun, Energy Minister Shakti Bahadur Basnet, and NEA Executive Director Kulman Ghising on social media, urging them to withdraw the Take and Pay provision.
This digital campaign comes just days after developers handed over a memorandum to the Prime Minister and bombarded top officials with hundreds of SMS messages requesting the same.
Why Are Entrepreneurs Worried?
Entrepreneurs claim that this decision will:
- Weaken the private sector’s role in the energy industry
- Risk the return of load-shedding (power cuts)
- Causes financial losses to investors
- Damage the overall economy
The Independent Power Producers’ Association of Nepal (IPPAN) has strongly opposed the provision. According to IPPAN’s Vice President and protest coordinator Mohan Kumar Dangi, the policy shift will discourage private hydropower development, especially for Run-of-River (RoR) projects, which are most affected by the new model.
Ongoing Protests and Next Steps
Since Asar 6, private power developers have been staging a phase-wise protest. On the third day of their movement, they moved their campaign to social media to raise public awareness and pressure the government.
Dangi warned that if the government ignores these peaceful efforts, the protests will escalate. Planned steps include:
- Lobbying political party leaders in Parliament
- Launching a nationwide street protest
- Returning the keys of privately built hydropower projects to the government — a symbolic act of handing over control
Background: The Budget Controversy
The controversy started when the budget for FY 2082/83 (announced on Jestha 15) stated that all future PPAs for RoR hydropower projects would be done under the Take and Pay model only. This was a major change from the previous Take or Pay model, where producers were paid even if electricity wasn’t consumed, offering more security for private investors.
Conclusion
The ‘Take and Pay’ decision has sparked serious concerns across Nepal’s private energy sector. Developers fear this could lead to a slowdown in future hydropower investments, and possibly, a return to unstable electricity supply. With pressure mounting both online and offline, the government’s next move will be critical for the future of Nepal’s energy landscape.
Nepal Rastra Bank (NRB), the central bank of Nepal, has announced it will withdraw NPR 60 billion in deposits from the banking system on Monday through a deposit collection auction. This move comes as excess liquidity continues to remain in the banking sector since the beginning of the current fiscal year 2081/82.
According to NRB, the withdrawal will be conducted through the online bidding system, and the interest rate will be determined through competitive bidding. The collected amount, including both principal and interest, will be settled on Shrawan 18, 2082 (August 2, 2025).
Key Auction Details
- Total Amount: NPR 60 billion
- Minimum Bid Amount: NPR 100 million
- Bid Increments: Must be divisible by NPR 50 million
- Eligible Participants: Class ‘A’, ‘B’, and ‘C’ licensed banks and financial institutions
- Auction Method: Competitive bidding via NRB’s online platform
- Maturity & Settlement Date: Shrawan 18, 2082
Why Is the Central Bank Taking This Step?
As per NRB, the banking system is currently holding excessive liquidity, with total deposits crossing NPR 7 trillion. However, this liquidity is not being effectively utilized, as loan disbursement has remained slow. This reflects a lack of investor confidence and limited credit demand in the economy.
To control liquidity and stabilize the financial market, NRB has been consistently withdrawing funds using monetary tools since the start of the fiscal year. Tools like reverse repo, outright sale, deposit collection, and bond issuance are being used depending on the situation, whether there is too much or too little money in the system.
Recent Trends in Liquidity Control
Last week alone, NRB withdrew NPR 90 billion in a single day, highlighting the ongoing efforts to manage surplus liquidity. The central bank is using such actions not only when there is an overflow of money but also in times of shortage, to maintain balance in the financial system.
Conclusion
The decision to withdraw NPR 60 billion on Monday shows that Nepal Rastra Bank is actively managing liquidity to ensure financial stability. With a large amount of unused funds in the system, these measures are crucial to prevent inflation, reduce financial risk, and encourage more effective use of capital in the economy.

The microfinance sector in Nepal has been moving sideways for a long time. The group sub-index has been fluctuating between 4,600 and 5,600. Recently, the index reached a swing high of nearly 4,900 but then closed at 4,671.74.
The national budget did not bring any immediate changes that could affect the capital market. So, investors are now waiting for the upcoming monetary policy. After the newly appointed Governor of Nepal Rastra Bank, Dr. Bishwanath Paudel, reduced the risk weight on margin loans from 125% to 100% during the third quarterly review, investor confidence grew.
Investors now hope that the following changes will be introduced in the next monetary policy:
- Removal of the current Rs. 15 crore limit on individual investment
- Removal of the 15% dividend cap on microfinance institutions
- Permission for banks and financial institutions to trade shares for less than one year
Governor Paudel’s public remarks have made investors hopeful that the upcoming monetary policy will be share-market friendly.
Despite the pressure on the market at the end of Ashar, investors are optimistic about a rebound afterward. Experts say microfinance and insurance stocks—whose prices have not surged yet compared to others—might offer better opportunities in the coming days.
Top 20 Microfinance Companies Nearest to 52-Week Low
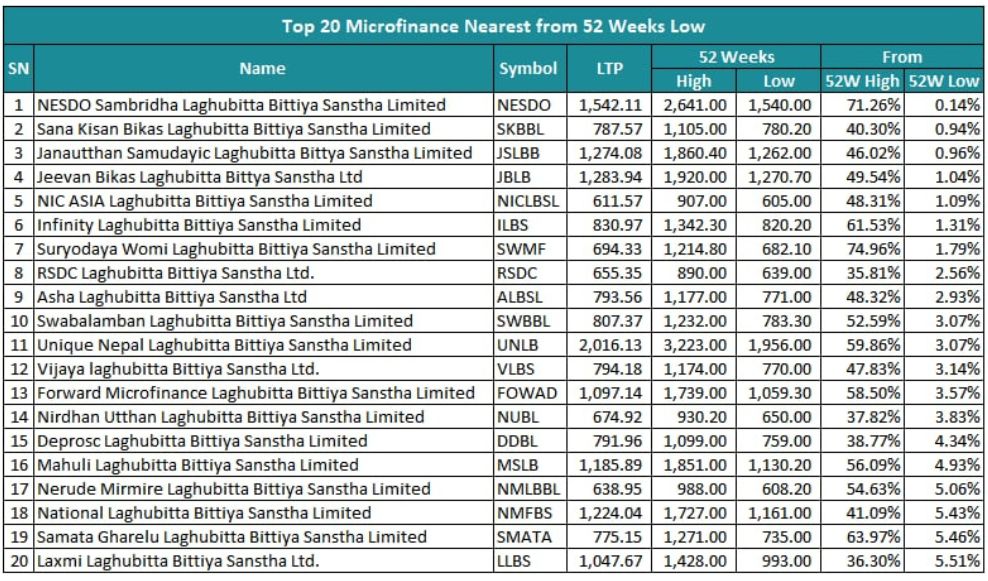
Some microfinance companies are trading close to their 52-week low prices. These stocks may offer good value for long-term investors. Here are some examples:
-
Nesdo Samriddhi Microfinance had a high of Rs. 2,641 and a low of Rs. 1,540 in the past year. It is currently trading near its lowest point.
-
Sana Kisan Bikas Microfinance and Jan Utthan Community Microfinance are both trading less than 1% above their 52-week lows.
-
Jeevan Bikas, NIC Asia, Infinity, Suryodaya Womi, RSDC, Asha, and Swabalamban Microfinance are trading just 1–3% above their yearly lows.
-
Other companies like Unique Nepal, Bijaya, Forward, Nirdhan Utthan, Diprox, Mahuli, Nerude Mirmire, National, Samata Gharelu, and Laxmi Microfinance are also trading only 3–5.5% above their low points.
According to experts, these stocks could be worth watching for those looking to invest at lower prices.
Microfinance Stocks Near 52-Week High
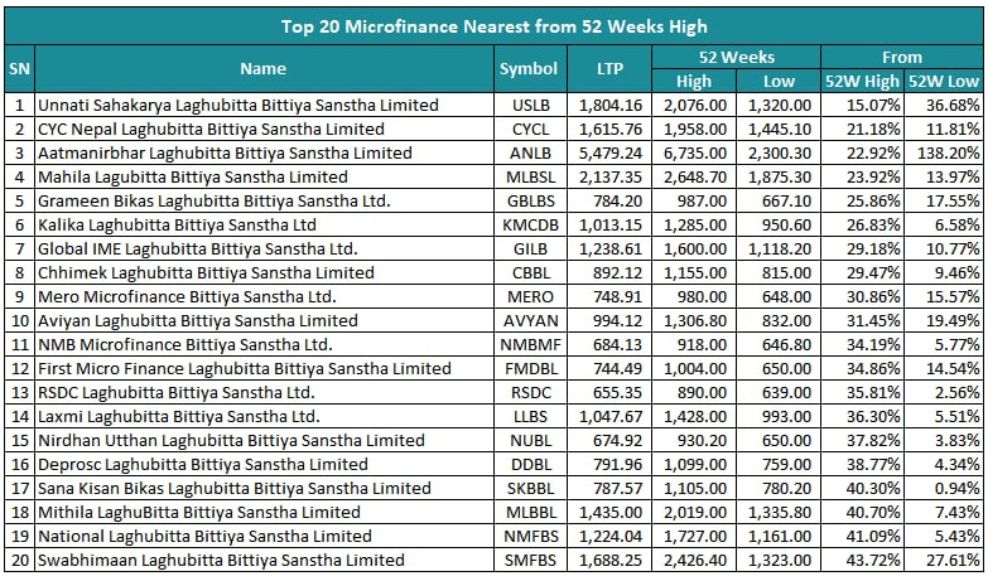
Interestingly, a few companies are still trading near their 52-week highs even though the overall market is in a downtrend:
-
Unnati Sahakarya Microfinance reached a high of Rs. 5,276 and is now trading at around Rs. 1,804.
-
CYCL Nepal Microfinance had a high of Rs. 1,958 and is still trading at Rs. 1,615, which is relatively strong.
On the other hand, many microfinance stocks are trading 20–40% below their 52-week highs:
-
Aatmanirbhar, Mahila, Grameen Bikas, Kalika, Global IME, Chhimek, Mero Microfinance, and Abhiyan are all trading 22% to 31% below their highs.
-
NMB, First Microfinance, RSDC, Laxmi, Nirdhan Utthan, Diprox, Sana Kisan, Mithila, National, and Swabhiman are trading 34% to 44% below their 52-week highs.
These stocks may still have room to rise if the market recovers and favorable policies are introduced.
Conclusion
The microfinance sector in Nepal is at a turning point. While the market has been moving sideways, investor confidence is building, especially with hopes for a supportive monetary policy. Stocks near their 52-week lows may offer attractive entry points, while those holding near their highs show relative strength.
For both new and experienced investors, this could be a good time to study the microfinance sector closely and plan for the long term. As always, careful research and risk assessment are essential before making any investment decisions.


Private Power Producers Protest ‘Take and Pay’ Provision in Budget

Nepal Rastra Bank to Withdraw NPR 60 Billion from the Banking System on Monday

52-Week Low & High Microfinance Shares in Nepal: Current Status and Future Outlook
Hydropower Gains 7.8% in One Month, Outperforming All Sectors
Private Power Producers Protest ‘Take and Pay’ Provision in Budget
Nepal Rastra Bank to Withdraw NPR 60 Billion from the Banking System on Monday
-
 Blogs3 days ago
Hydropower Gains 7.8% in One Month, Outperforming All Sectors
-
 Blogs8 hours ago
Private Power Producers Protest ‘Take and Pay’ Provision in Budget
-
 Blogs9 hours ago
Nepal Rastra Bank to Withdraw NPR 60 Billion from the Banking System on Monday
-
 Blogs10 hours ago
52-Week Low & High Microfinance Shares in Nepal: Current Status and Future Outlook
-
 Blogs1 year ago
List of Stock Brokers in Nepal with NEPSE TMS Login – Updated
-

 Blogs10 hours ago
Asian Life Insurance to Issue Rights Shares from Asar 25
-
 Blogs6 months ago
Siuri Nyadi Power Limited Added to IPO Pipeline by SEBON
-
 Blogs3 months ago
Pure Energy IPO For General Public